The AI Bubble Breaks When Growth Slows, Not When It Falls
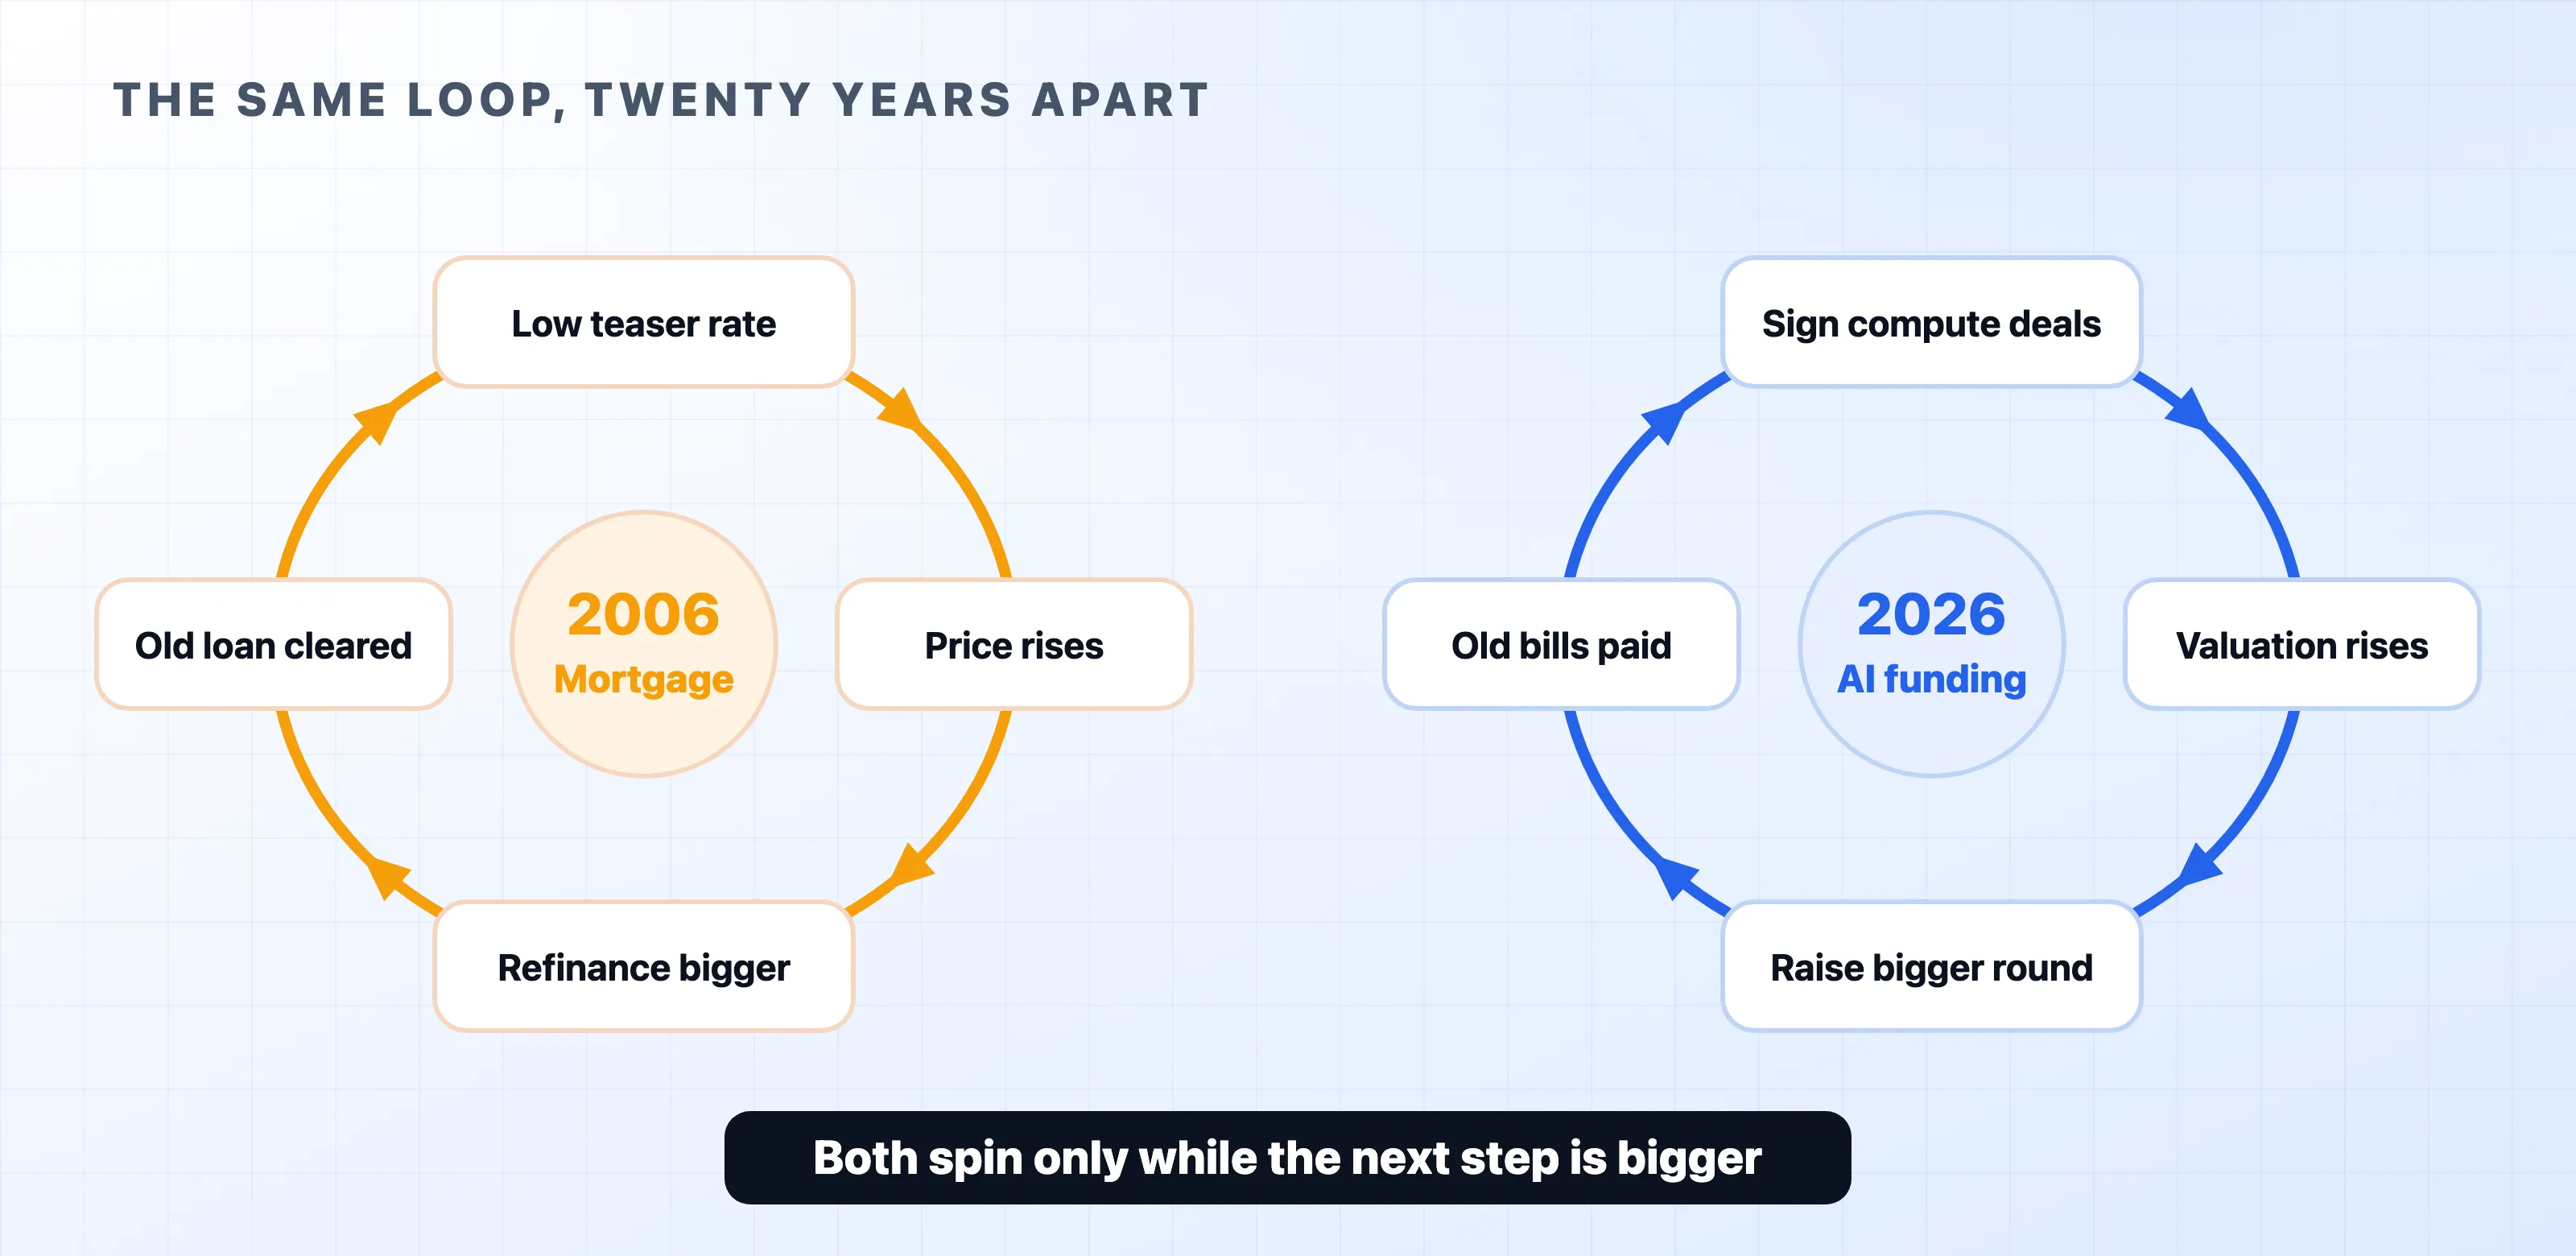
The AI boom is funded by a refinancing loop that needs growth to keep accelerating. In 2006 the same loop broke while house prices were still at record highs.
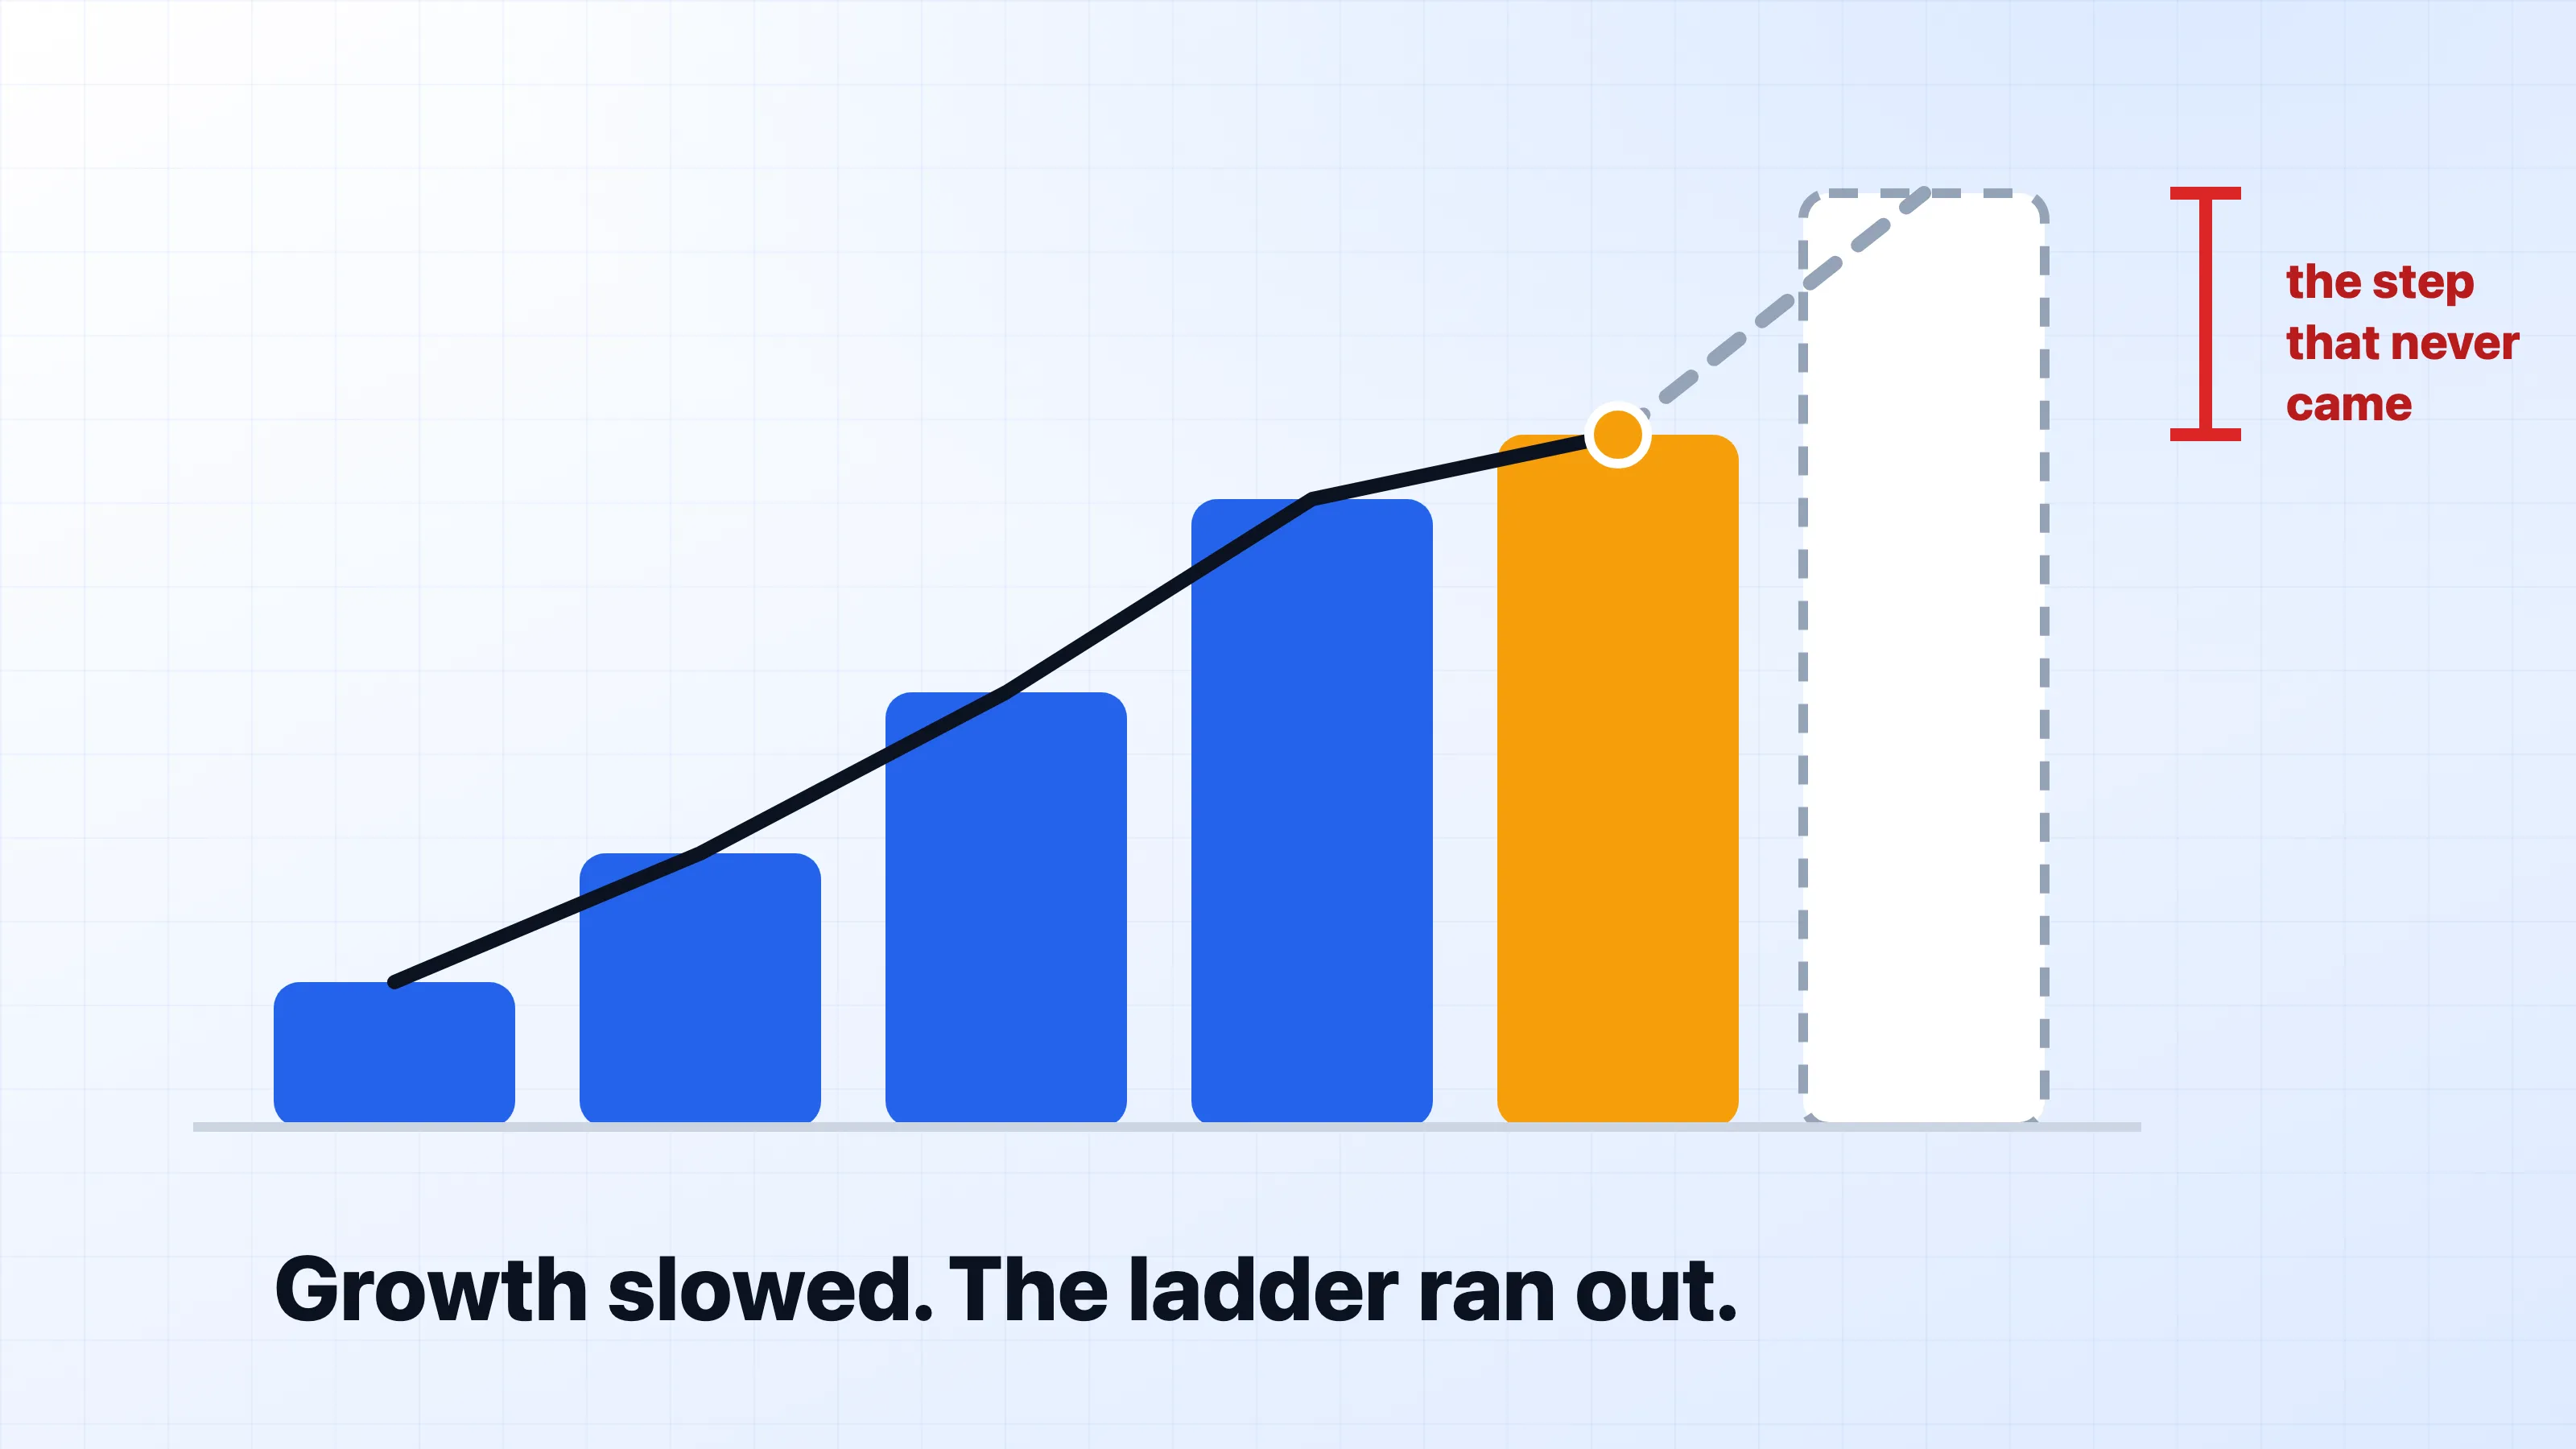
The AI bubble does not need a crash to break. It breaks when growth slows.
The 2006 comparison comes from the video 2008 vs 2026: The Same Dominoes Are Falling. Every figure below is sourced and linked. None of it is investment advice.
Money that pays the last bill
Start with the funding loop. Everything else depends on it.
OpenAI closed a $122 billion round on 31 March at an $852 billion valuation. It makes $2 billion a month, booked $13.1 billion last year, and is still burning cash. At the same time it signs enormous compute contracts with cloud providers. The new money, raised at the higher valuation, pays the older compute bills.
This is a refinancing loop. The funding round services the last round’s obligations rather than paying out on earnings. The rising valuation acts as the company’s income statement.
A loop like this stays stable as long as the next funding round is bigger than the last one. It has no other way to survive.
Backlog as collateral
The big cloud providers book the other side of those contracts as future revenue.
Microsoft, Oracle, Google and Amazon report a combined $2.3 trillion of contracted future revenue: $678 billion at Microsoft, $638 billion at Oracle, $514 billion at Google Cloud, $496 billion at AWS. OpenAI and Anthropic account for roughly half of it. OpenAI alone is about 54% of Oracle’s book.
Then comes the second step. The cloud providers do not just sit on those commitments. They borrow real money against them and spend it on data centers. Amazon, Microsoft, Google and Meta are spending $725 billion on capex this year, up 77% from $410 billion. A promise from an unprofitable buyer becomes collateral for debt. That debt pays for concrete, power, and silicon.
If you run infrastructure, this is where the story stops being about finance. That build-out is why GPU capacity exists at today’s prices. It is the reason your AI inference bill looks the way it does.
What broke in 2006
Most people think the last financial crisis started in 2008. The actual structure died in 2006, back when the press still called the market healthy.
The instrument was the 2/28 ARM, a mortgage with a low teaser interest rate for two years. After that, the payment jumped to a level the borrower could never afford. Nobody actually planned to make those later payments. The plan was that the house would be worth more in two years. The borrower would then refinance into a bigger loan and use it to clear the old one.
Then in 2006, house prices did something unremarkable. They kept rising, but at a slower pace. FHFA measured 4.3% over the year to Q4 2006, against 10.7% the year before.
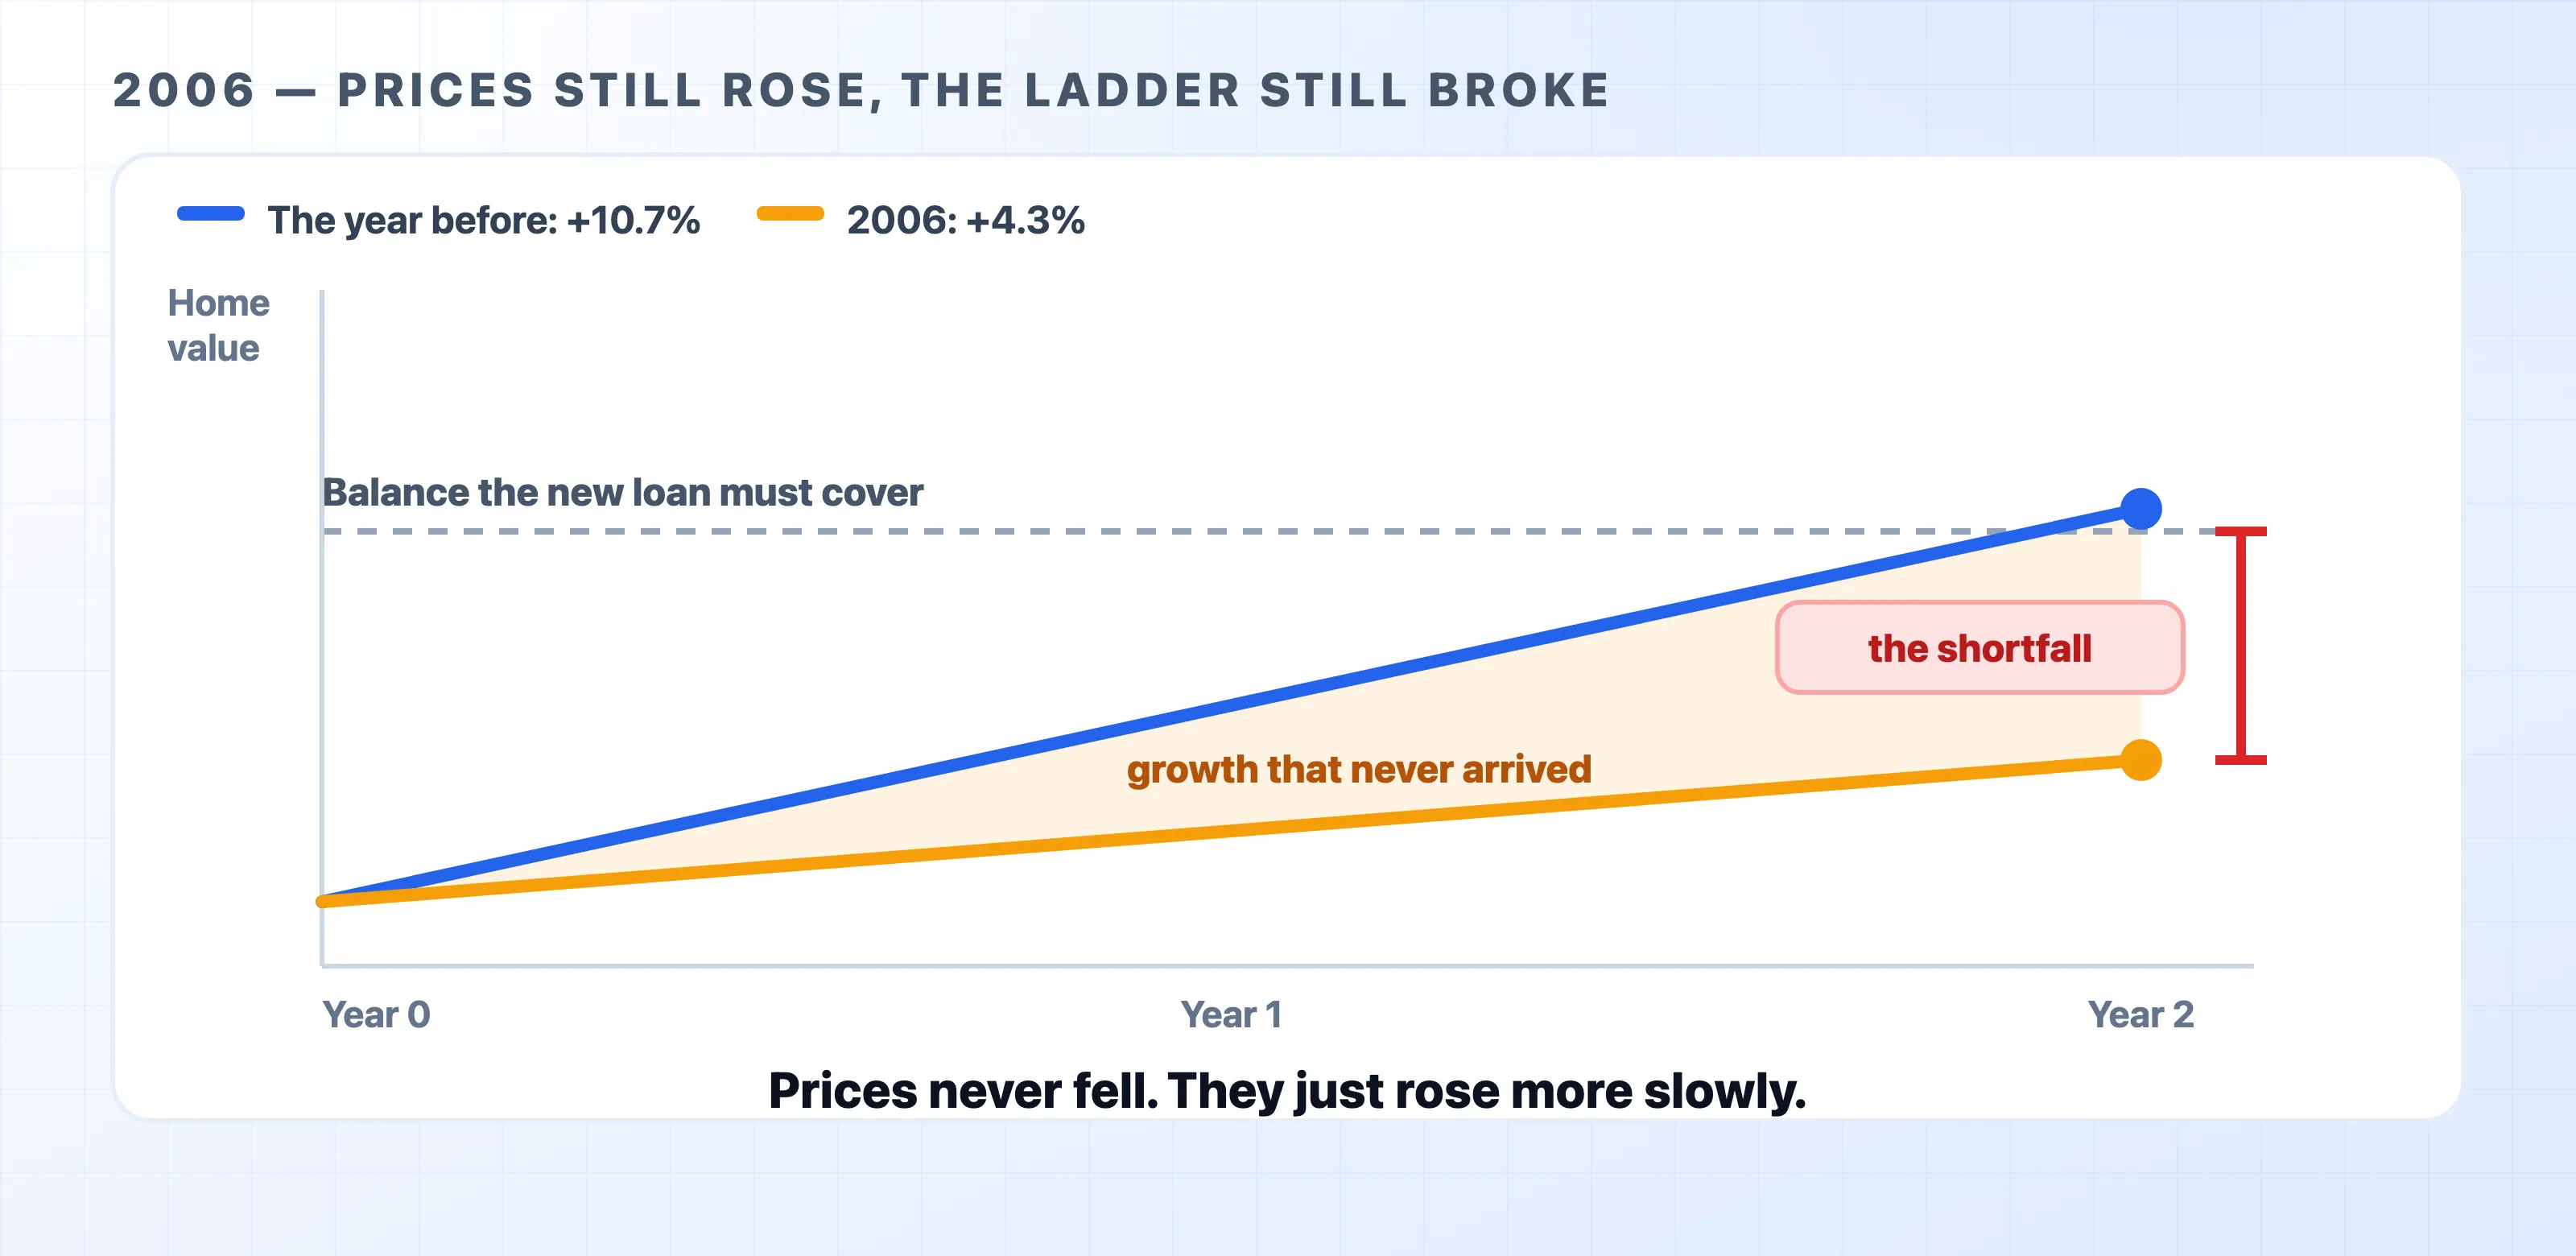
That slowdown was enough. The new loan had to cover the old balance plus fees. At 4.3%, the house had not gained enough value to make the math work. The refinance ladder lost a rung. Borrowers defaulted in waves while prices were still at record highs. The exit door they were promised simply vanished.
Prices did not have to fall. Just slowing down did all the damage.
The cheap model shock
The AI funding loop has the exact same weakness. Right now, something is pressing on it.
The Chinese lab Moonshot released Kimi K3, a 2.8 trillion parameter model. It took first place on the Frontend Code Arena at 1,679 points, ahead of Claude Fable 5, and it runs two to three times cheaper than the frontier models, up to ten times on a cache hit. Moonshot then published the weights under a modified MIT license.
Chinese models do not need to be better than American ones. They just need to be close enough and nearly free. That puts a ceiling on what US labs can charge. It pulls price-sensitive customers away. That directly hits the revenue growth rate, which is the exact number these massive valuations rely on.
Washington has discussed banning Chinese models in response. That creates a new problem. US companies would lose access to the cheap tools their global competitors get to keep using. Meanwhile, domestic labs would lose the competitive pressure that forces them to ship faster.
The third borrower
There is another borrower behind the borrowers.
The US government spends more than it collects. The rolling twelve-month deficit is $1.9 trillion, about 6.1% of GDP, and it rolls maturing debt into new debt. As of September 2025, 33% of federal debt outstanding was due to mature within twelve months, against 24% a decade earlier. A growing share of the pile reprices at whatever rate the market asks on the day. Interest already costs about $1.05 trillion a year.
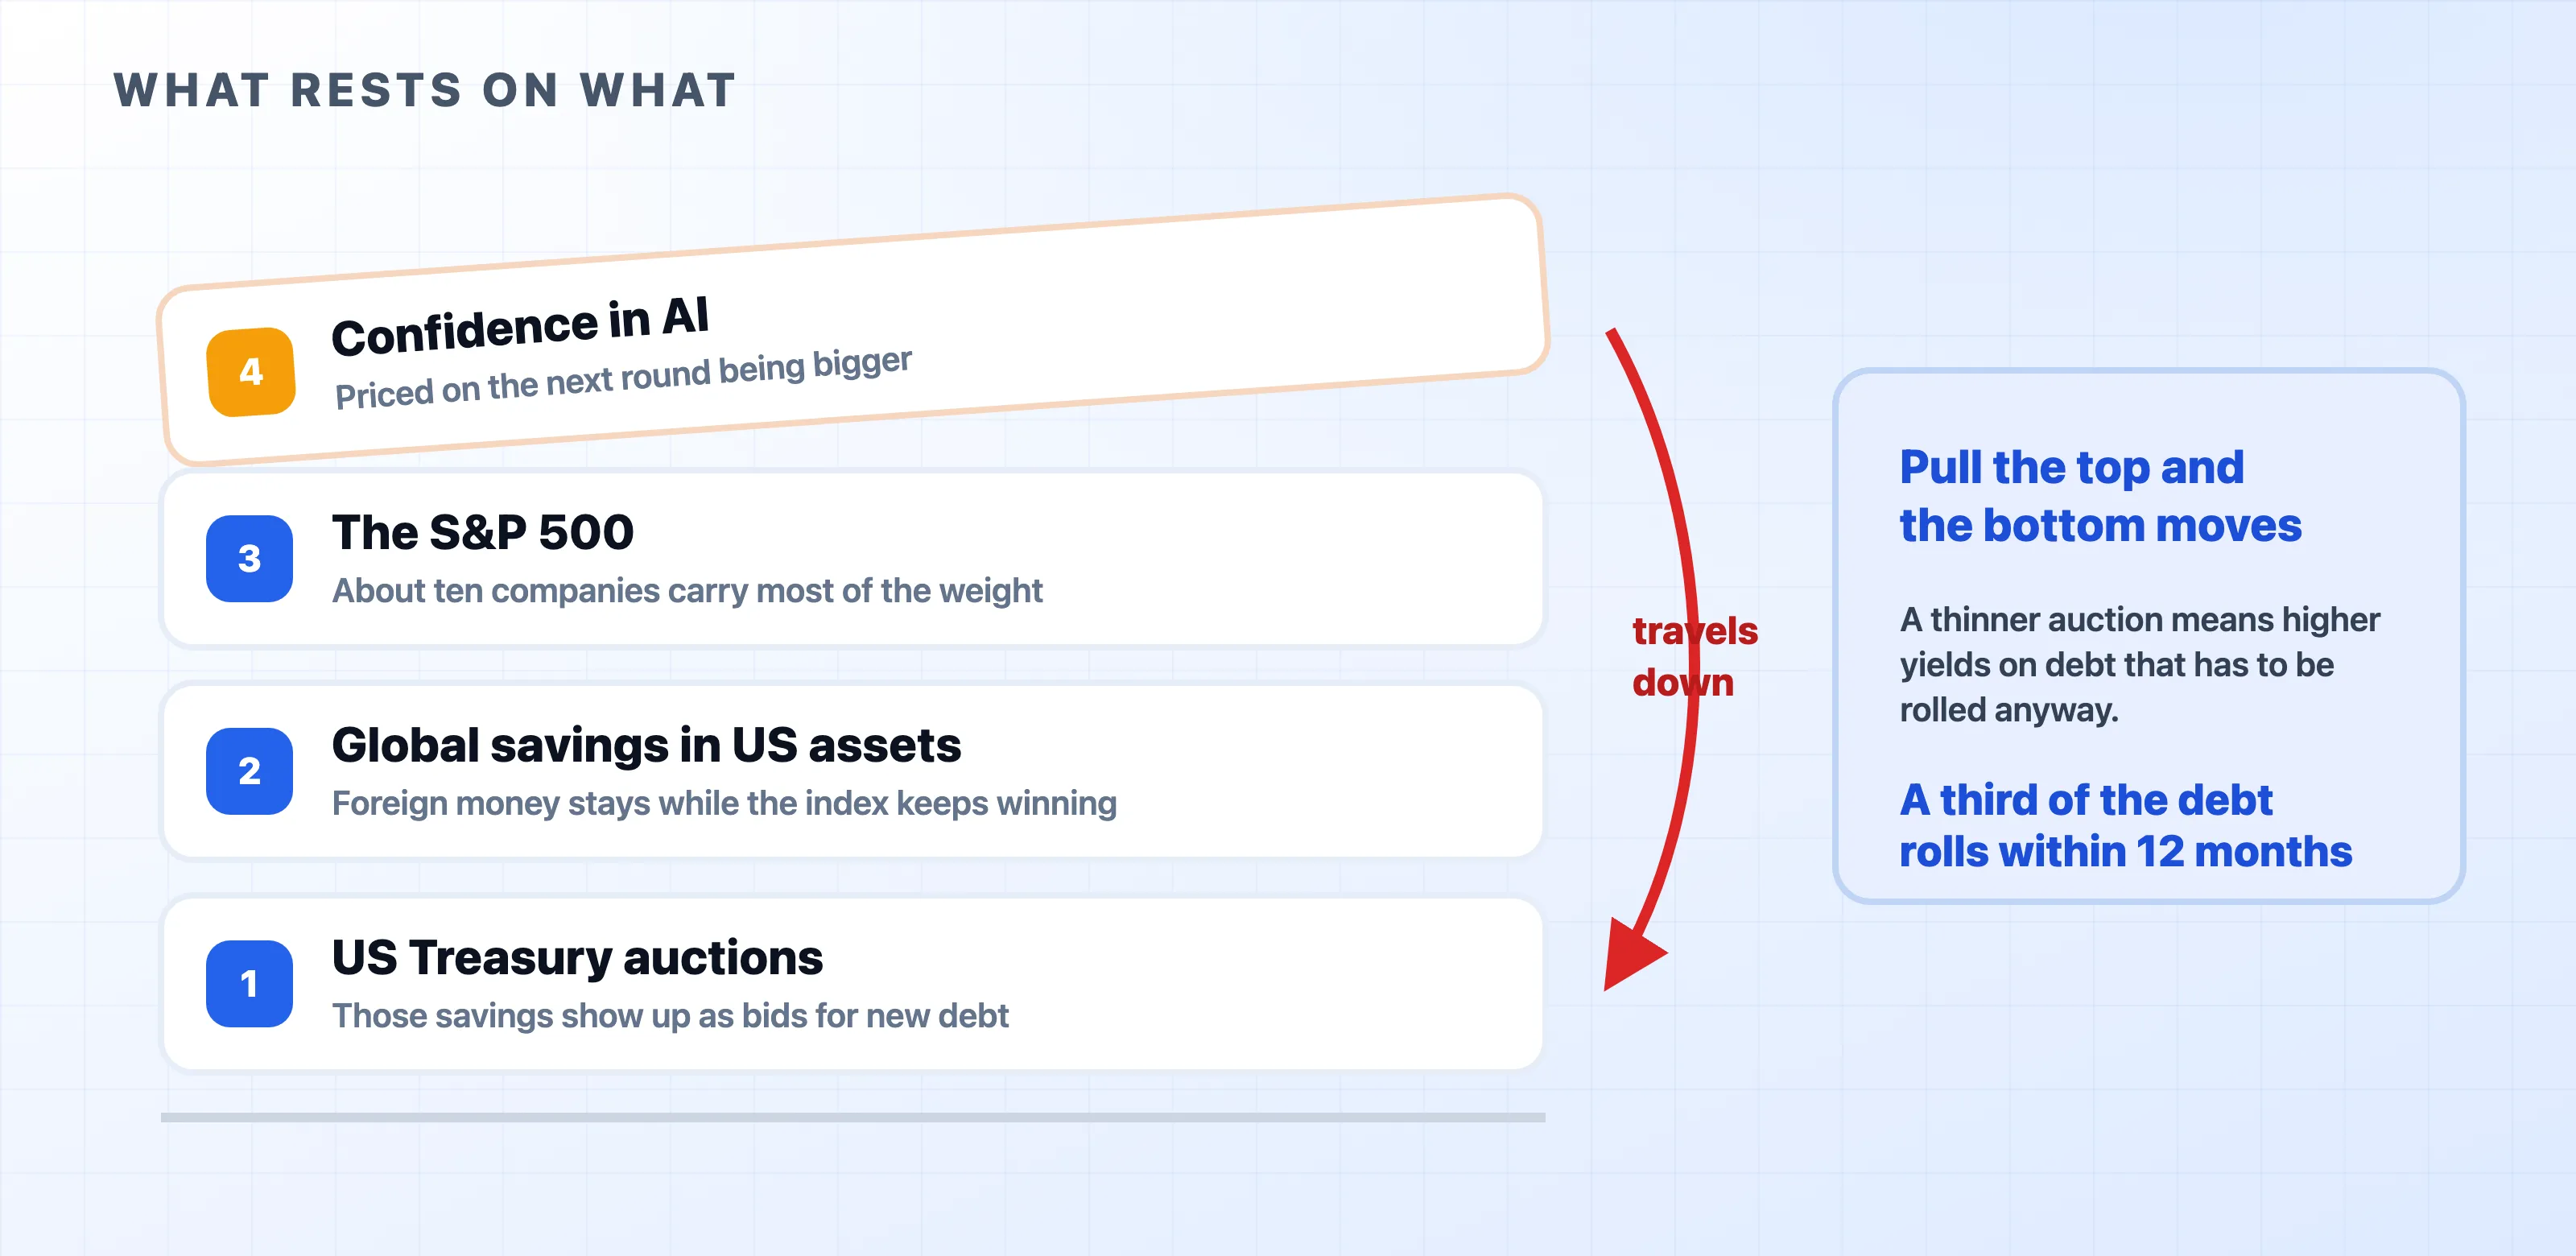
Now stack the pieces. Confidence in AI holds up the S&P 500. The S&P 500 keeps global savings parked in US assets. Those savings show up as bids at Treasury auctions.
If you break the top of that stack, the bottom moves. In 2008, frightened money ran into Treasuries. If the story that breaks this time is American technology itself, some of that money might look elsewhere. A thinner auction means higher interest rates on debt the government has to roll no matter what.
Who actually gets paid
This is where the story separates from pure doom.
A financing loop can be fragile at the top while the middle of the chain is perfectly real. In every build-out, the reliable money goes to whoever sells the picks. Nvidia ships silicon and gets paid on delivery. TSMC builds the chips. Underneath both sits a materials layer nobody talks about: the tungsten, copper, and specialty metals that go into factories, turbines, and data centers. I watch the tungsten and specialty metal suppliers for this reason, MSR and EQR among them.
The test is simple. Does the company collect cash from a customer who already has the money? Or does it book a promise from a customer waiting on their next funding round? Nvidia and TSMC sit on the first side. A large part of that $2.3 trillion cloud backlog sits on the second.
This is the definition of counterparty risk. It measures how much of what you own depends on somebody else staying solvent. The S&P 500 now concentrates an extreme share of its weight in about ten companies. An index that feels diversified is really just one bet with ten names on it.
What to watch
Do not try to time the top of the market. The gap between the 2006 slowdown and the 2008 collapse was almost two years. Being early looked exactly like being wrong for most of that time.
Watch the growth rate instead of the record highs:
- The step-up on OpenAI’s next round. The number that matters is the percentage increase over the last round. A smaller step means the ladder is shortening.
- Whether the backlog keeps expanding. Flat committed revenue means the collateral stops growing, but the debt against it keeps piling up.
- Capex guidance against the share price. Pay attention if a cloud provider cuts data center spending while its stock goes up. That is the market applauding the end of the race.
On the personal portfolio side, I hold roughly 20% in hard assets like gold and silver. I do this for the same reason I moved my own projects off a bill I could not predict when I went from AWS to Cloudflare. Metal has no counterparty, and nobody can print more of it based on a policy decision. That is my personal allocation and risk tolerance, not a recommendation for yours.
The engineering takeaway is narrow and useful. Today’s GPU prices are subsidized by a funding loop, so build with the assumption that inference costs more later, and keep your model layer easy to swap while the cheap options are still on the table.